


What you need to know about FTP, CP, mFTP, W', and Other Training Acronyms
Untangling the knot.

The Best Efforts Curve
The best efforts curve is simply a representation of the maximum power you have been able to produce during a period of time, plotted on two axes for each specific duration. For example, if in 1 second you managed to produce 1000 watts, you place a point at 1 second at the 1000-watt level. If in 2 seconds you managed 990 watts, a point is marked at two seconds slightly lower.
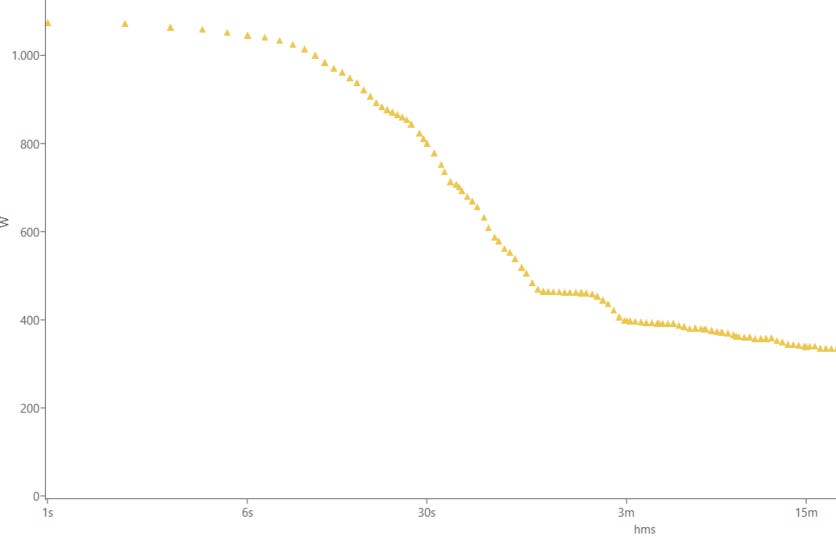
Thus, you plot the point that represents the highest power for each duration. When the points are connected, a line is formed. This graph can be made using power or speed.
The Power-Duration Curve
The power curve is a function that tries to approximate the best efforts curve as accurately as possible. In other words, the power curve is a mathematical model that helps to estimate what power you might have produced for each duration, even if you haven’t performed a maximum test for every interval, based on your records of shorter and longer efforts.

An important aspect of the power curve is that it relies only on your best efforts. It’s crucial to note that this curve is calculated with different points depending on the chosen model.

While your daily performance fluctuates based on hundreds of factors—the most obvious being motivation, recovery, nutritional status, and environmental factors such as temperature and altitude—the power curve only captures the values with the greatest deviation to the right, the extreme days among the extremes. This creates significant issues when attempting to model everyday performance based on what happens on those "rare" days.
Some models use only two points from this curve (for example, the best performance between 3 to 5 minutes and the best performance between 10 to 20 minutes), while other models are multi-component, incorporating efforts of many durations to make the curve more closely resemble the best efforts curve.
Each model has its pros and cons.
The power-time curve can also be plotted using speed, referred to as the speed-time curve.
It’s called a curve because if the y-axis is plotted on a linear scale (i.e., normal scale), it takes on a curved, hyperbolic shape.
SPOILER: On logarithmic axis it is not a curve but a straight line (a power law)
Critical Power
It’s no coincidence that I mentioned that the power curve has a hyperbolic shape. This means it has one or two asymptotes. An asymptote means there is a value that the curve gets closer and closer to but never actually reaches, like the Bitcoin big rise.
Well, critical power corresponds to the horizontal asymptote of the function modeling the power curve. That is, the wattage value we approach as the duration of the effort increases, but theoretically, we never reach.
Thus, critical power is associated with concepts like the “anaerobic threshold” or “steady state,” leading to the belief that below this critical power, we can maintain the pace for a long time.
Obviously, we know that this hyperbole does not exist in reality, and I’ve already explained that modeling performance as a hyperbole is an error, but it’s essential to understand that for models, this hyperbole exists to help us understand when and how to use them or adjust their potential biases.
That said, in the context of these models, critical power represents the highest work capacity that can be maintained without using anaerobic metabolism, relying solely on aerobic metabolism. It is generally accepted that critical power occurs at an intensity equivalent to the maximum lactate steady state, making it useful for distinguishing between zone 3 or vigorous domain and zone 4 or severe domain, above threshold.
W’
The previous assumption, that critical power is the highest intensity at which we can work using aerobic metabolism, implies that above this power or speed, the extra energy generated comes from anaerobic sources.
W’ measures the capacity of this anaerobic battery, which depends on the power used and the duration of its use. In physics, the product of power multiplied by time is called WORK, hence the "W."
For example, if our critical power is 300 watts and in 5 minutes we can produce 350 watts, the model tells you that those extra 50 watts come from anaerobic metabolism.
In this example, the athlete's battery is calculated as follows: 50 extra watts times 300 seconds = 15,000 joules, or 15 kJ.

W’ models operate on the premise that an athlete’s anaerobic work remains the same whether the battery is emptied in 1 minute or 15 minutes, although, as we will see, this is not true, and some methods are more efficient than others.
When W’ is calculated using the speed curve, it is called D’ since the multiplication of speed by time equals distance (hence the "D").
On the other hand, FRC is the equivalent of W’ used in the WKO5 software. It’s similar to the difference between Microsoft Excel and Apple Numbers—essentially the same thing but with a different name.
mFTP and FTP
The difference between FTP and mFTP is significant.
mFTP is an equivalent to Critical Power used in WKO5. It functions similarly but is calculated with more than three parameters, which has its pros and cons.
Thus, mFTP is a mathematical construct that depends on the power curve and does not correspond to any exact duration. mFTP can match your best effort for 30 minutes, 40 minutes, or even slightly over an hour, depending on where the model sets the athlete’s threshold.
Conversely, FTP is a real performance metric.
Originally, FTP was the highest power an athlete could maintain for 1 hour. Simple yet challenging, as conducting a 1-hour test is impractical in real terms.
Therefore, FTP is often estimated through shorter tests, like a 20-minute test. This makes it easier to test but also introduces error margins since some people subtract 5% from the 20-minute power, others 8%, others 10%, and so on.
This has led to a new metric, the E-FTP (Ego FTP).
The Ego FTP is the FTP athletes claim to have, calculated by adjusting all estimation variables in their favor. From the 20-minute test, you subtract the minimum percentage, add 5% because you could have pushed harder, and another 5% because it was hot. The goal is for your E-FTP to be higher than the power you can maintain in 5 minutes.
In reality, it doesn’t matter if you do a 20, 15, or 30-minute test as long as you know why you’re doing it. There’s nothing magical about 60 minutes. If our ancestors had divided the day into 10 hours instead of 24, no one would think there’s anything magical about the power you can sustain for 60 minutes, but here we are.
There are advantages and disadvantages between FTP and CP or mFTP models. FTP varies less than the models, making it clearer for training and avoiding noise issues. However, the advantage of models is that they give you a critical power value based on efforts of different durations, so you don’t always need to do the tests.
Each athlete and coach, depending on their sport and capabilities, will choose to use one method, another, or none, and may employ new submaximal tests that are easier to implement daily.
I see many triathletes getting super caught up in all these metrics and testing protocols, sometimes missing the forest for the trees.
If we're looking at Critical Power vs FTP models for Ironman racing where our real battle is actually against fatigue over many hours while maintaining good form (swim, bike, run), should our primary focus be on maximizing our "rare best days" metrics (like CP/W'), or rather on building a really solid aerobic engine that consistently performs just below threshold over longer durations?
I see many coches and athletes getting almost paralyzed trying to figure out which model to follow, doing test after test, when maybe we should be focusing more on that consistent aerobic development that lets us actually finish the marathon strong - particularly by not over doing the bike, which is very frequent in Ironman racing.
The training implications could be quite different, especially when we factor in that we're juggling 3 sports and need to stay fresh enough to run well off the bike.
Would love to hear your thoughts on this!
eFTP is also used in the TrainerRoad, Rouvy, and the JOIN cycling softwares, but I haven’t researched to see if they are the same, or if they independently invented their own eFTPs.