


I hate maximal effort tests for measuring performance because I know that most people misinterpret them and, based on the performance of a single day, think they are better or worse than they really are.
In the biomedical model on which Sports Science and many other health sciences are based, organisms are viewed as machines: operating in a standard way that does not vary.
We are used to thinking as if we were engines that perform almost the same every day if environmental conditions are identical.
And it’s very hard to understand that a person’s performance follows a normal distribution. This means that even if you control all environmental or nutritional variables, most days you’ll perform close to your average, but there will be days when you’re far above and others when you’re far below.
This variability is inherent to Complex Systems, due to their self-organized configuration, and it cannot be eliminated no matter how much we try to replicate the same conditions (although doing so certainly minimizes the variance margin).
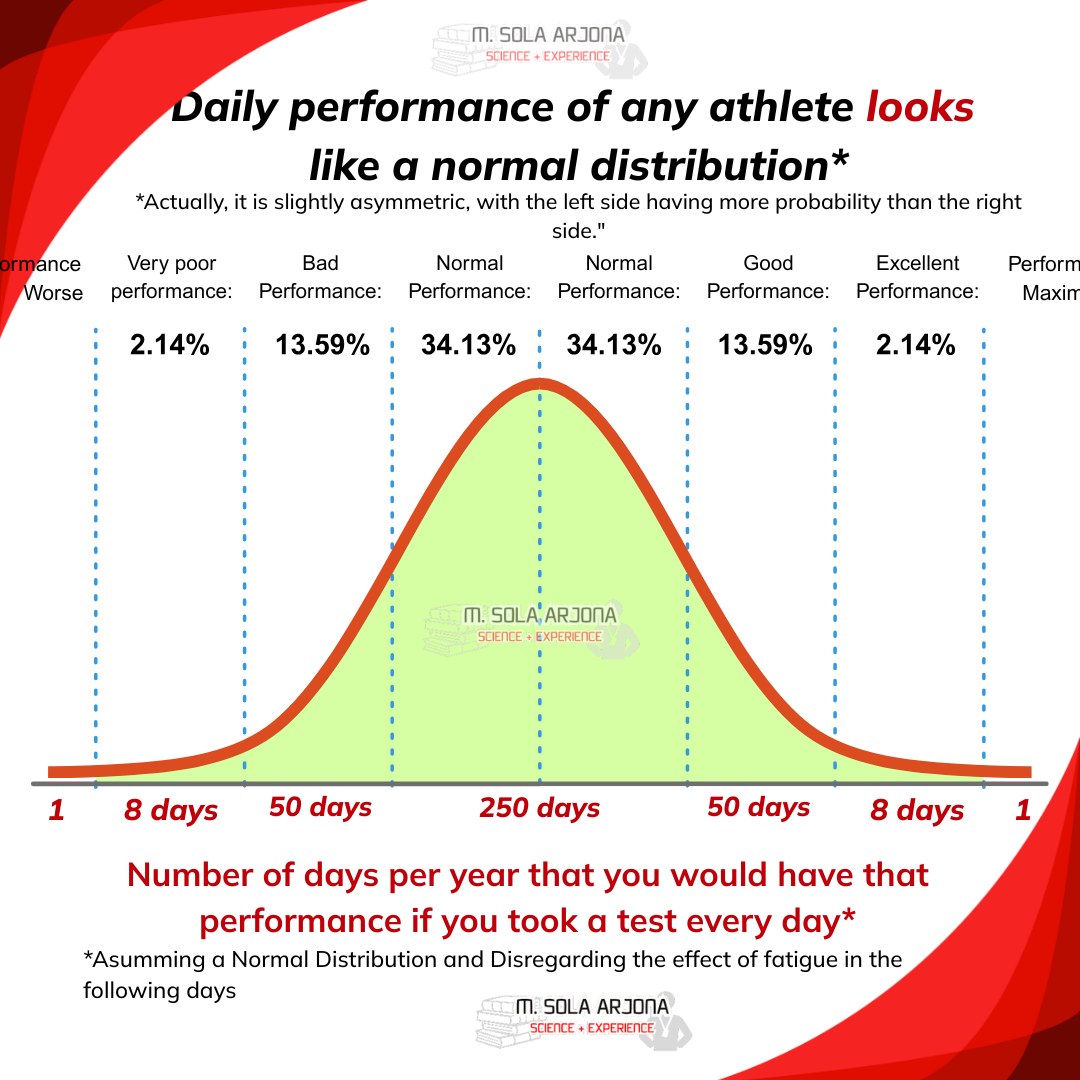
Let´s do a mental exercise: Imagine you did 365 maximal tests*, one every day of the year (assuming you don’t accumulate fatigue or change fitness). The expected result would be that about 250 days you'd be roughly near the average (if your average was 300w, we would expect those 250 days to be between approximately 285 and 315w), about 50 days below that (270-285w), 50 days somewhat above (315-330w); 8 very bad days (255-270w), 8 incredibly good days (330-345w), and perhaps one terrible day (<255w) or one record-breaking day (>345w).
*Theoretical example, assuming a Normal distribution (in reality would not be this same percentages and assuming an average of 300w and a standard deviation of 15w (5%), ignoring the effect of fatigue or fitness improvement from prior tests.
This happens in exercise, but you can also apply it to any other biological function: cognitive ability, mental clarity, perceived well-being, mood, fatigue, sexual desire…
You are neither as good as on your record days, nor as bad as on your worst days.
That’s why a single test is so risky for drawing conclusions about your performance. It could simply be that you’re not properly motivated that day, you slept poorly, or—especially in athletes who don’t manage nutrition or tapering properly—you didn’t test in the same conditions (temperature, time of day, etc.).
This is a serious bias inherent in training zones based on maximal tests, power/speed curves, or “fatigue resistance” metrics, where extremely good days get mixed with normal or very bad days; and ultimately, conclusions are drawn about an athlete that really reflect more the noise and biological variability than a true discovery of strengths or weaknesses.
To paraphrase a part of my book The Nature of Training:
(…)
The probability of achieving a certain performance is described by a probability curve. Within your current fitness level, your performance on any given day may be higher or lower than expected due to a complex combination of factors. Most days you’ll perform close to your mean performance, but there will be some days well below or well above.
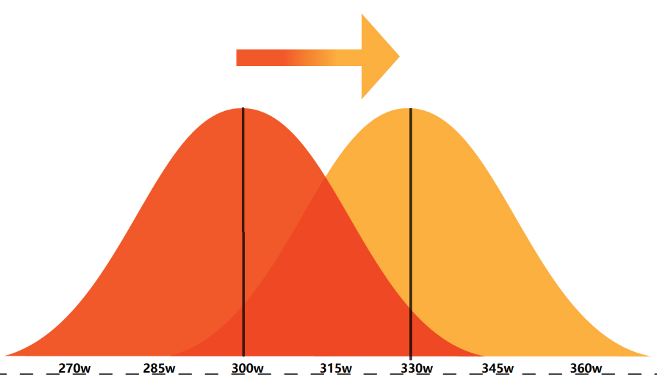
If you repeated a test 100 times under identical circumstances, you’d expect to perform near your average most days, some days 5–10% better or worse, and very few days much better or worse. In this example, two athletes could both produce 315w in a 20’ test, but one performed above what they’d do on average over 100 tests, while the other performed below their average.
That’s why a single data point is not a reliable way to understand what’s really going on. It could be that after three months of training you’re fitter, but that on that specific day your motivation is lower or it’s hotter, and you produce fewer watts than three months ago.
This is a problem in the power-duration curves generated by software or durability models: they mix training sessions under ideal conditions with others under less-than-ideal ones (heat, altitude, prior fatigue, or simply lower motivation, mixing races with training sessions).
One way to address this is through averaging. The more tests you perform, the closer the average will reflect reality, since good and bad days tend to balance each other out. This can help us compare seasons by looking at the average of the top 3, 5, or 10 efforts of a given duration to see whether the overall level has improved, or whether it was simply “a lucky day” (or a calibration error).
But practically speaking, this is hard to implement during the season. Each test is still a high-intensity session, and if we perform too many tests, we won’t have time for real training.
Therefore, we can use maximal tests of different durations to track progress at high intensities (red zone, purple zone, maximal power) and as power or speed anchors to determine targets for high-intensity intervals, while using submaximal tests and indicators to monitor aerobic performance progression week by week.
(…)
In conclusion:
Even at the same fitness level, we won’t perform equally well in all tests. One solution is to use an average of our test results or rely on submaximal test data and parameters that are less influenced by that day’s motivation.
(If not, at least understand that this variability exists and don’t get discouraged if we don’t beat our previous test.)
When we analyze data, we take the best effort for each duration, but the best effort doesn’t represent the average, which means we risk overestimating our actual level. That’s why it’s not a good strategy to set your training zones based on a hill time trial in competition.
When we combine data from efforts of different durations or with different levels of prior fatigue (fatigue resistance curve), we often mix efforts performed on “good days” —with higher motivation or better environmental conditions— with others done in worse conditions —training sessions or less favorable environments—, creating statistical noise that’s often stronger than the real variation in performance. For example: if your best 5-minute effort was done during normal training and your best 20–40-minute effort was in a hill-climb race, the models will likely overestimate your Critical Power or mFTP because the short 5-minute effort is lower than it could be, which in turn makes your W′ or FRC appear smaller.
Understand that you can be stronger than before yet have worse test results, or be in worse shape but perform better one day —and that doesn’t mean anything.
Vingegaard can beat Pogacar one day, and a bad tennis player can win a game against Nadal; but when you compete often, performance tends to average out.
See you next time,
Manu